
Reading Time: 14 minutes
Consideration of the weather is a key aspect in ensuring safe and enjoyable bushwalking and ski touring. Good weather makes for a great trip. Bad weather, especially when not anticipated and planned for, can create dangerous, unsafe circumstances.
Weather forecasts and safety
Trip planning should take into account the range of possible weather conditions. Leading up to the trip, the weather forecast including emergency warnings should be monitored. Monitoring should continue during the trip whenever there is mobile phone reception. This ensures advance warning of any adverse or extreme weather that could require the planned trip to be modified, or even make it unsafe to proceed.
For any bushwalk, particularly extended trips or trips to remote or exposed locations such as a coast or mountainous terrain, regular, careful observation of the weather, a knowledge of the basics and the broad reasons for the vagaries of Australian weather will assist with weather prediction during a trip.
It is possible that weather knowledge developed over time through observation and experience may be limited to a local area or regular walking areas – e.g. familiarity with regional weather patterns.
That knowledge will be less useful on trips to other areas or States. Therefore, careful attention to weather forecasts is especially important when visiting a new area.
Install the Emergency app for each State visited, to access fire and weather warnings: New South Wales, Queensland, South Australia, Tasmania, Victoria; West Australia.
Related information can be found here:
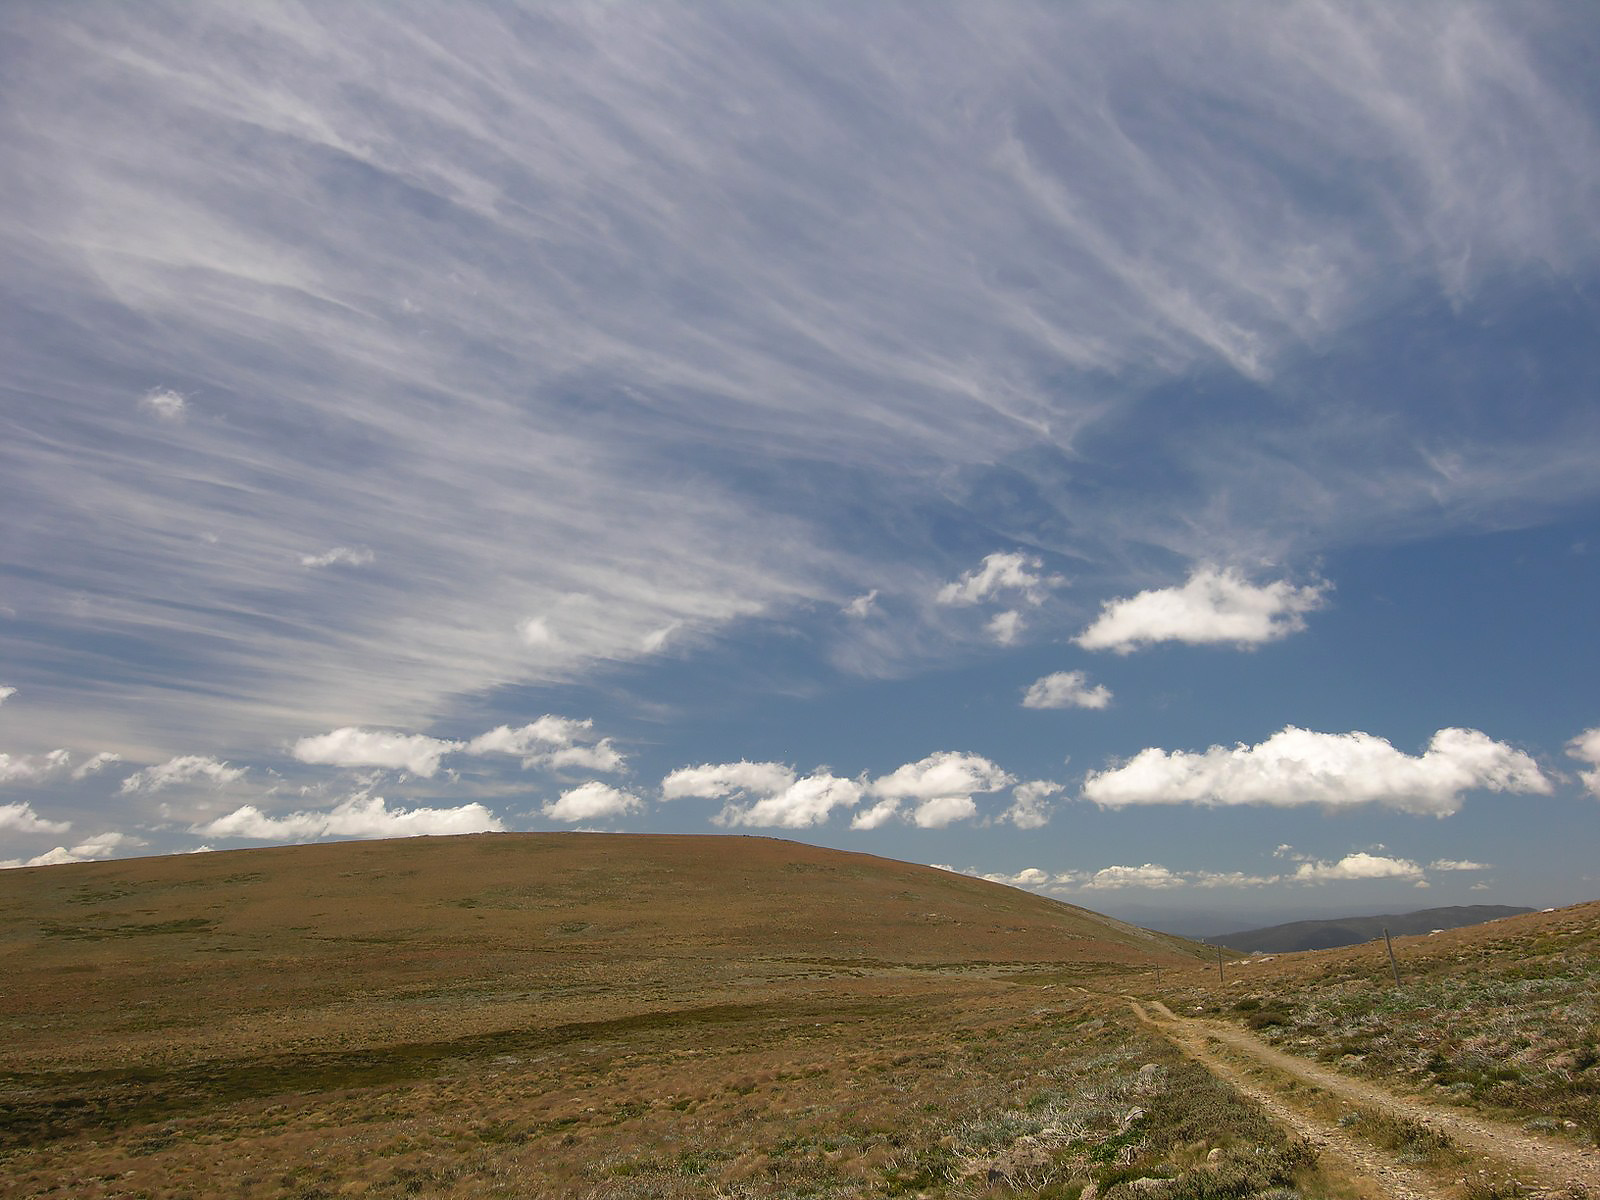
The weather in south-east Australia can bring snow to mountain tops in summer and can mean the difference between an enjoyable walk through Tasmanian mountains and a trip in which it is a struggle to stay warm and dry and find a safe campsite.
Desert storms can flood usually dry rivers and gorges, and dust storms can turn day into near night.
The wet season in tropical northern Australia can bring astounding amounts of rain.
Weather knowledge
Weather knowledge is greatly improved by paying close attention to the daily weather forecasts and observing the weather.
- Regularly watch a good TV weather forecast. For example, ABC 24 has regular detailed forecasts that include discussion of current weather systems.
- Listen for key words that can herald bad weather: e.g. front, trough, depression, low pressure, falling pressure, increasing cloud/wind.
- Conversely, these words may suggest good mountain weather: calm or light winds, high pressure, anticyclone, rising pressure, clear skies, fog and/or frost warnings.
- Read the daily weather forecast and then observe the weather.
- Do this over a number of days to track the passage of weather systems.
- Become familiar with the terms commonly used to describe the weather. At the same time, try to identify clouds by reference to pictures.
- Study the weather map and forecast the weather before reading the text. Check with the given forecast.
The key to all forecasting is to look at approaching weather. This applies both to reading weather maps and anticipating any significant changes and observing the weather during a trip – e.g. looking into the wind and in the direction of approaching weather.
Weather basics
The basic elements of weather are:
- Temperature
- Cloud, fog
- Precipitation (rain, snow, hail, etc.)
- Wind
- Humidity
- Lightning
Weather occurs as a result of movement of the atmosphere. The majority of weather phenomena are caused by the vertical movements of parcels of air:
- Rising air expands, cools and sheds moisture as cloud droplets, rain, hail or snow
- Sinking air is compressed, warms and can carry more moisture – clouds dissipate as water droplets evaporate into invisible water vapour in the warming air.
Winds occur at ground level because of differences in the weight of air above different locations. The weight of air at any location on the ground’s surface is called the air pressure. If the pressure at one location is greater than the pressure at an adjoining location, the surface air will move from the high pressure to the low pressure. This is surface wind.
Various atmospheric movements attempt to equalise the weight of the atmosphere above points at sea level. Consequently maps of these weights or pressures, at sea level, can show much of the broad-scale horizontal and vertical motion of the atmosphere. The lines drawn on weather maps connect points of equal pressure and are called isobars.
Winds do not flow directly from high to low pressures. The rotation of the earth causes the winds to flow almost parallel to the isobars but:
- outwards from high pressures
- inwards towards low pressures.
Isobars closer together on a weather map indicates that pressure differences between adjoining locations are higher so the winds will be stronger.
Pressure systems
The daily weather map shows regions of high and low pressure from which general predictions of winds can be made. At ground level, air flows outwards from a high pressure system. So the column of air in the high-pressure system is generally sinking towards ground level. As air sinks, it is compressed (by the weight of air above) and warmed. Clouds evaporate and the weather is generally sunny.
On the other hand, at ground level air flows into areas of low pressure. So the column of air in a low-pressure system rises and expands. The air cools and any water content tends to condense into clouds. Clouds may form and, depending on the amount of water vapour in the air, rain and other forms of precipitation may occur.
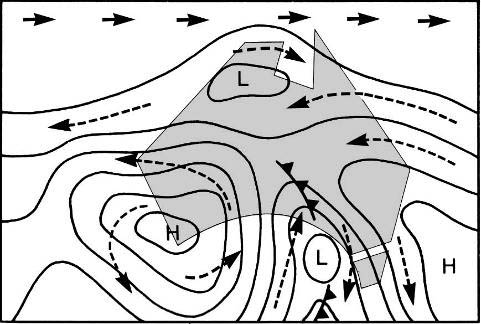
The weather patterns over Australia show interspersed areas of high and low pressure, as shown in Figure 1. These generally move from west to east.
Wind direction, shown by arrows, is predominantly parallel to the isobars. It spirals outwards from highs (where air is sinking and warming) and inwards to lows (where air is rising and cooling). Wind travels clockwise around lows and anticlockwise around highs. Thus, if you face into the wind, the low is on your left.
Usually, isobars are closer around lows, indicating stronger winds. Knowing that Australian weather systems generally move from west to east, a strong northerly wind can indicate that a cold front is on the way, and conversely, a cold southerly wind heralds improving weather.
However, beware of the occasional low pressure system moving down the east coast of Australia. This can bring worsening weather with southerly and south-easterly winds, particularly in the north-eastern regions of Victoria and southern New South Wales.
In the equatorial regions, particularly in summer, the ocean waters warm significantly. In areas of low pressure, moisture-laden air rises. At the condensation level, cloud forms and the heat released by the condensing vapour causes upward moving air currents. More heat is released as more vapour condenses, large thunderstorms are created and the monsoon rains are experienced. This leads to periods of very high humidity and temperature, known as the ‘build up’, typically in November–December. This is then followed by several weeks of very heavy monsoon rains.
The incredible energy stored in weather events in northern Australia can lead to cyclones – very deep lows with destructive winds reaching 200 km/h at times. Cyclones form over the sea and generally lose energy as they pass over land, making coastal areas and offshore islands at most risk.
Cyclone weather alerts are issued at times of high, direct threat from a particular storm. These must never be ignored – the energy of cyclones can devastate whole communities. If walking in cyclone prone areas during the cyclone season (typically November–March) always carry an effective means of accessing the daily weather forecast and any emergency warnings.
See Emergency communications for more information.
In southern Australia, the patterns of highs and lows are established to the south and west of the continent. They flow over Australia from west to east.
Within central and northern Australia, ‘heat’ or thermal lows are produced by contact between land that is heated to summer temperatures of above 40°C. Air in contact with the land warms and rises. Often there is no moisture associated with these lows.
Air masses
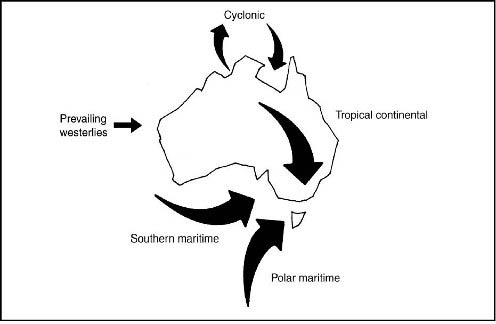
The likely wind direction and origin of the air can be anticipated knowing the sea-level wind movement is along weather map isobars. The air temperature experienced, and the moisture content of this air, has been established over many days and is reasonably constant over hundreds of kilometres, so will provide useful information on the likely temperature and potential for rainfall. Figure 2 shows the main types of air masses that affect Australia:
- Generally prevailing westerlies: Moist air over western coastal areas which condense where raised by topography.
- Cyclonic tropical: Very strong, moist winds producing heavy rain over affected northern coastal areas.
- Tropical continental: Very hot, dry air which produces heatwave conditions when it moves south (hot northerlies in summer). The air has been heated by contact with the dry, hot land in central Australia.
- Southern maritime: A reasonably moist air stream with temperatures determined by the southern oceans over which it has passed.
- Polar maritime: Very cold, partly moist air, originating over the Antarctic Ocean. It produces sudden cold snaps and heavy snow falls.
Air mass temperature
Air mass temperature is predominantly affected by conduction and convection, and a little by radiation. Ski tourers will have experienced the biting southerly wind under a cloudless sky. Convective temperature changes are evident in the large, fluffy ‘cotton wool’ cumulus clouds and the thunderstorm (cumulonimbus) clouds.
At the surface, air exchanges heat with the ground. During a cloudless day, the ground absorbs radiation from the sun and heats up the surface layer of air via conduction. This air, heated by contact with the ground, rises (or convects upwards) and expands. As it rises, it cools. As a result, water vapour in the air mass may form a cloud at a condensation level, the height of which depends upon the amount of water vapour in the air. The resulting flat-bottomed cumulus clouds may develop into thunderstorms as the heat released by the condensation drives the air parcel higher. The tops of thunderstorm clouds may reach as high as 12,000 m.
Cooling at night
Conductive cooling of an air mass occurs on clear nights. The earth cools by radiating energy into space. The air in contact with the ground cools. If there is much wind, this cooling effect is distributed through many hundreds of metres of the atmosphere and little change in air temperature is noticed on the ground.
On still, clear nights, particularly during the passage of the centre of a high pressure system, only the bottom few metres of the atmosphere will be cooled. Depending upon the moisture content of the air, fog may occur and, depending on the initial ground temperature, cooling may proceed to freezing point producing frost. In hilly country, the cooled air will drain into valley floors (katabatic wind) producing frost hollows. In such conditions, a warmer night will generally be experienced up on the valley sides.
A layer of cloud acts as a blanket, slowing radiative cooling and generally resulting in warmer nights. Similarly, a tent pitched under a crown of trees will escape frost that would cover a tent pitched in the open.
Fronts
Fronts represent the interface between different air masses and are generally accompanied by substantial changes in weather. The cold front is the most common type of front in southern Australia. A colder air mass is displacing a warmer one, as shown in Figure 3. Cold fronts are usually linked to low-pressure systems and occur in two forms:
- Type A: A deep, rapidly moving, cold wedge of air, lifting unstable warm air. As the front approaches, warm humid north-westerly winds freshen, carrying scattered low cloud. High clouds increase and become darker and lower. The anvil head, often present with thunderstorm clouds, may be visible. Light rain quickly turns to heavy showers and thunderstorms with associated gusty winds. The winds turn cooler and west to southerly as the front passes.
- Type B: A shallow, slow moving wedge of cold air lifts moist, stable warm air. Because of the slow movement and the shallowness of the wedge, the vertical motion of the warm air is relatively slow. High clouds extend well ahead of this type of front. The frontal cloud extends back behind the front for many kilometres and rain falls over a wide area.
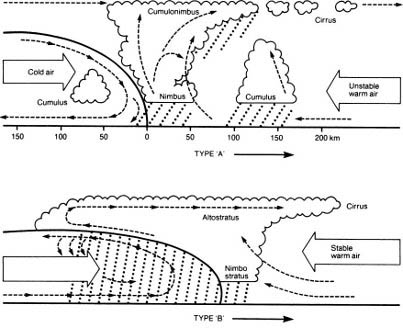
The whole process of the Type B front passing a particular locality is slower than that of Type A. The high cirrus clouds may precede a front by 12 to 36 hours.
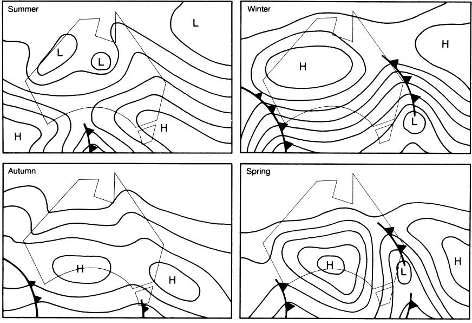
Seasonal variations
There is a general seasonal variation in the paths traversed by the pressure systems and in their relative intensities, as shown in Figure 4. Hot summer conditions are indicated by high pressure systems moving south of the continent, whereas winter conditions are typified by high pressure systems moving across continental Australia.
Mountain influence
Bushwalkers and ski tourers in mountain areas need to be prepared for weather conditions very different to those in low-lying country. The following aspects of weather are affected by mountains.
Atmospheric pressure
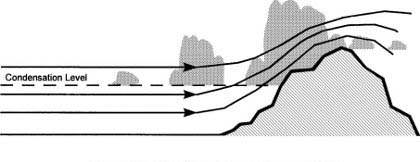
Air pressure at the tops of mountains is less than at sea level or the valley floor. Air flowing over mountains will therefore be forced into an area of lower pressure and will expand and cool. In cooling, the air will shed moisture and can produce cloud, rain and snow. Mist swirling around ridgetops and summits is a common manifestation of this effect.
On the lee side of the mountain, the descending air increases in temperature and clear periods are more frequent, as shown in Figure 5. If precipitation occurs, the clouds will dissipate at a higher level on the lee side than they formed on the windward side.
If there is a choice of routes to leave some high country in bad weather, head for the lee side.
Temperature and sunshine
If air is well mixed (as in windy conditions), the air temperature decreases with increasing altitude at a rate of 0.6–1.0°C per 100 m for humid air, and about 1.0°C per 100 m for dry air. For example, if the temperature at sea level is 10°C, at 1500 m it will be below freezing point. This is why extra warm clothing is needed for trips to the mountains.
As atmospheric dust and moisture content decreases with increasing altitude, on a clear day the direct sunlight at 1200 m contains twice the amount of ultraviolet light as at sea level. So in the high country, without clouds, extra care to protect from UV radiation is necessary.
Wind speed
Wind is the movement of air to equalise atmospheric pressure. Because of friction at ground level, winds are often gusty, but have reduced velocity. At higher altitudes, winds are often stronger and steadier.
Knowledge of wind speed is important, and vitally so in winter conditions, where even a light breeze can reduce the environmental temperature (the temperature as felt by the human body) to an uncomfortable level. The wind speed on open land above 1000 m is about two to two and a half times stronger than on more sheltered low-lying land.
Air temperature is also affected by humidity: the raw conditions of winter and the mugginess or oppressiveness on a sultry summer’s day are well-known effects.
To cool down, the body needs to lose heat to the environment, mainly through conduction to the air layer surrounding the body. If this does not provide sufficient cooling the body perspires and evaporation helps the cooling process. In both cases, the rate of evaporation, and hence effectiveness of cooling, is influenced by wind speed and humidity.
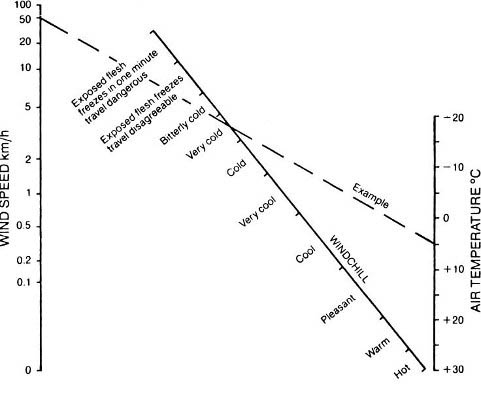
Wind chill is a measure of the effect of wind speed as a coolant. Air with an actual temperature of 4°C and a wind speed of 24 km/h, has a wind chill temperature of –5°C; and if moving at 48 km/h, of –11°C, as shown in Figure 6. The stronger the wind the greater the wind chill.
Rain shadows
Large mountains may strongly affect rainfall patterns. Moisture-laden air approaching a mountain range is forced to rise. It expands as it rises (because of the decreased weight of air above) and therefore cools. This cooling can force cloud formation and precipitation on the windward side and tops of the range. As the air descends the lee slope, it is compressed and warms. It can hold more moisture so precipitation may cease and clouds disappear, as shown in Figure 5. A rain shadow exists on the lee side of mountains and can give rise to a different vegetation regime.
In south-east Australia, rain-bearing winds normally come out of an arc from west to south. The Great Dividing Range provides a barrier for many of the less intense, low-pressure systems, with rain precipitating on the southern and western faces.
The south-east coast of New South Wales and eastern Victoria often experience relatively warm weather during cold and wet westerly or north-westerly winds elsewhere. These winds rise up the windward side of the mountains, cooling and shedding moisture. The relatively dry winds warm as they descend the lee side and move over the coastal regions.
The coastal hills of south-western areas of Western Australia are wetter than areas inland from the highest points of the ranges, and the Adelaide Hills in South Australia cause a rain shadow on the plains to their east towards the Murray River.
Humidity
Air humidity governs the formation of cloud, fog and dew. Humidity measurements provided by the Bureau of Meteorology, state the amount of water vapour in the air as a percentage of the maximum amount that the air can absorb. That water vapour is invisible. It only becomes visible as cloud, fog or precipitation when it condenses. The maximum amount of water vapour that a parcel of air can contain depends on its temperature and pressure (or height). If a parcel of air at 100% humidity cools, some of its water vapour will condense and become visible as cloud or fog.
Humidity greatly affects the comfort of bushwalkers. Low humidity air has the capacity to absorb water from objects it moves over. High humidity air is unable to absorb extra moisture. When walking, the body generates heat which must be dissipated by perspiration. As the perspiration evaporates, it cools the skin surface.
However, the evaporation process is very limited in high humidity because the air already has a high level of water vapour, so the cooling effect is reduced as the air cannot absorb much additional moisture. This is why humid weather is so unpleasant. Our bodies can overheat and become dehydrated as excess fluids are perspired. This is a particular concern in tropical regions of Queensland, the Northern Territory and Western Australia, particularly when high temperature is often combined with high humidity and little wind.
At the other extreme, ski tourers in winter often experience very low humidity air as winds from the south move north, warm up and increase their ability to absorb moisture. Low humidity air removes much more water from lungs than humid air, increasing the need for frequent drinks during heavy exercise.
Interpreting the weather
What does the wind indicate?
In open areas the location of a low pressure can be estimated by facing into the wind. In Australia, the low pressure will be on the left when facing into the wind. For example, if facing north and into the wind, the low pressure will be to the west. Worsening weather should be expected, as weather systems generally move in from the west.
Winds getting stronger from the north indicate that a strong change is approaching. The northerly wind will shift to a westerly then to a south-westerly.
If the wind is from the south, facing into the wind will show that the low pressure is to the east, and so moving away. The weather is likely to be improving.
What do the clouds indicate?
Clouds are the most visible indicators of weather and impending changes. There are three main cloud levels: high, mid and low.
In southern Australia, high-level clouds, such as cirrus or altocumulus, moving in from the west may indicate an approaching frontal system that could arrive in the next 12 to 36 hours. In tropical areas, such clouds may mean a quicker change for the worse.
A high flying aircraft leaving long-lasting contrails in the air indicates relatively high levels of moisture, also a forewarning of potential bad weather coming from the west.
Fluffy cotton-ball cumulus clouds may appear during sunny afternoons, as the warming earth heats the air which rises. Depending on moisture content, these fair weather clouds will appear. If the air is humid, it becomes unstable. The heat released by condensation drives the air to greater heights, producing more condensation. This feedback process continues and large cumulonimbus thunderheads develop, extending from low to very high levels. Watching this process can be exhilarating.
References and external links
Forecasts
- Australia’s official weather forecasts and weather radar – Bureau of Meteorology
- WillyWeather: Weather Forecast – Australia – A very useful weather forecasting site. Any location can be entered into the location box and a detailed, multi-day forecast is provided. The Temperature/Rainfall/Wind tabs provide detailed information graphically. Marine information on tides and swell is useful on coastal trips.
Learn more about the weather in Australia
Bureau of Meteorology: